Esmeralda Michel, Megan Mitchell, Nehal Eldeeb and Valerie B. Shapiro
This blog post is based on the Evidence & Policy article, ‘Promoting the use of research evidence from websites: optimising microsurveys as feedback loops to drive improvement’.
There are many efforts to make research evidence accessible to educators online through toolkits and in other user-friendly formats. Intermediaries – which are organisations that sit between research and practice – can take on the mission of synthesising, translating and sharing research for the public. One such intermediary is the Greater Good in Education (GGIE), an organization that hosts a website of evidence-based practices for educators. Yet a persistent challenge remains among these types of intermediaries: once research evidence is packaged and posted, how do we know the extent to which the evidence is being accessed, appraised and applied in practice? Intermediaries are missing ‘feedback loops’ that could help the intermediaries adapt and improve their efforts to promote the use of research evidence.
In a recent study published in Evidence & Policy, researchers Eldeeb, Ren, and Shapiro explored whether microsurveys could help fill this gap. Microsurveys are short surveys embedded directly on a webpage, triggered by specified interactions with the website. They can capture real-time feedback from users, providing actionable insights into whether research evidence is likely to be applied in practice.
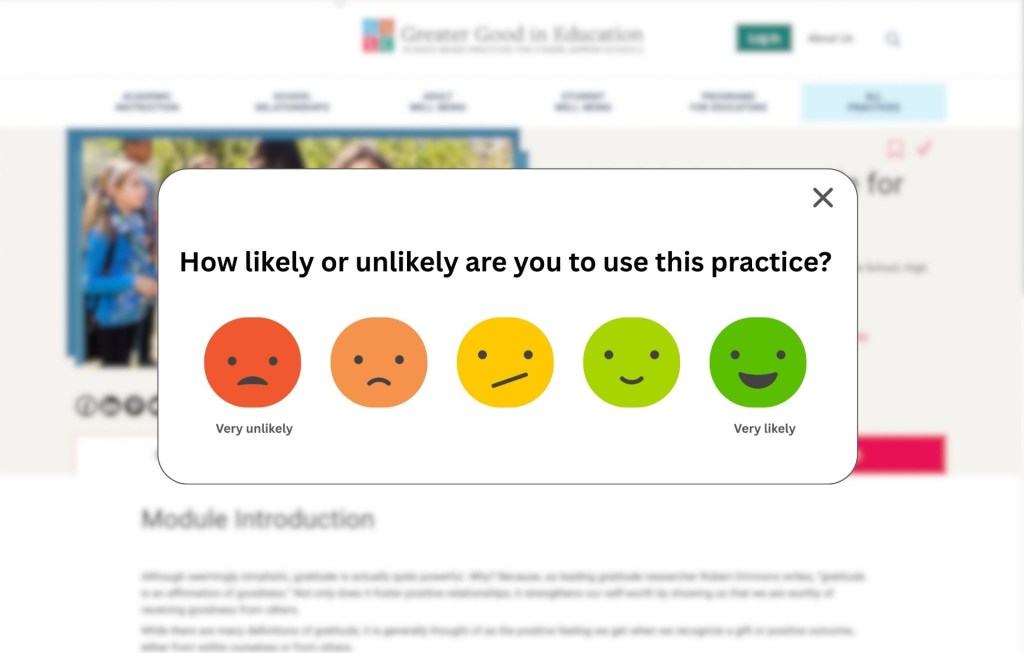
The researchers worked in partnership with Greater Good in Education (GGIE) to study whether practitioners would complete microsurveys about the research evidence with which they were actively engaging. For example, if a practitioner was reading about a practice to increase self-compassion, and a microsurvey asked, ‘How likely or unlikely are you to use this practice?’ – would the practitioner respond to the question or ignore it? Researchers tested different microsurvey configurations to encourage participation. Each microsurvey began with a brief introduction, followed by a 1–5 rating scale question (e.g. ‘How do you rate the quality of this practice?’). Based on their response, participants saw a second, open-ended, tailored question, such as: ‘What makes this a high-quality practice?’ or ‘What would increase the quality of this practice?’ (See Figure 1).
Figure 1. Exemplar microsurvey panels

Panel 1. Introduction to microsurvey

Panel 2. Initial Likert Scale question
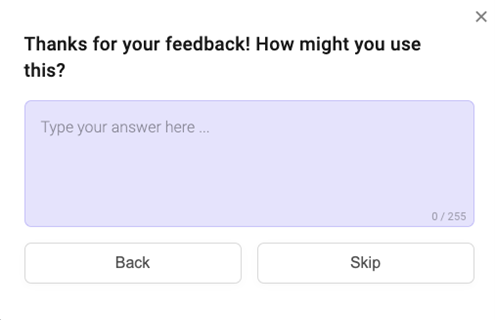
Panel 3. Follow-up open-ended question
We ran four small trials to identify what microsurvey configurations get the most responses. We experimented with 1) question wording, 2) pop-up timing, 3) number of clicks and 4) the best combination of design elements.
What we learned
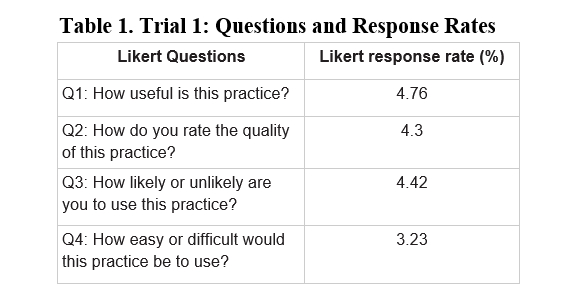
- Short and simple wins. Our first micro-randomised trial tested different questions (i.e., ways of asking for engagement). The most concise question achieved the highest overall response rate (see Table 1).
- Timing matters. Our second micro-randomised trial tested four timing options: 20, 30, 40 and 60 seconds from the trigger (page load) to pop-up. The 20-second delay and 40-second delay achieved the best response rate to the first question, but people were nearly three times more likely to answer the second question with the 40-second delay.
- Fewer clicks = more answers. Our third micro-randomised trial tested whether reducing the number of clicks (one click versus two) required to complete the survey would impact engagement. People were more likely to respond to the microsurvey when the invitation to participate (introduction panel) was combined with the first question, a configuration that required fewer clicks. The frequency of responses to the second question, presumably by highly engaged users, was unchanged based on click count.
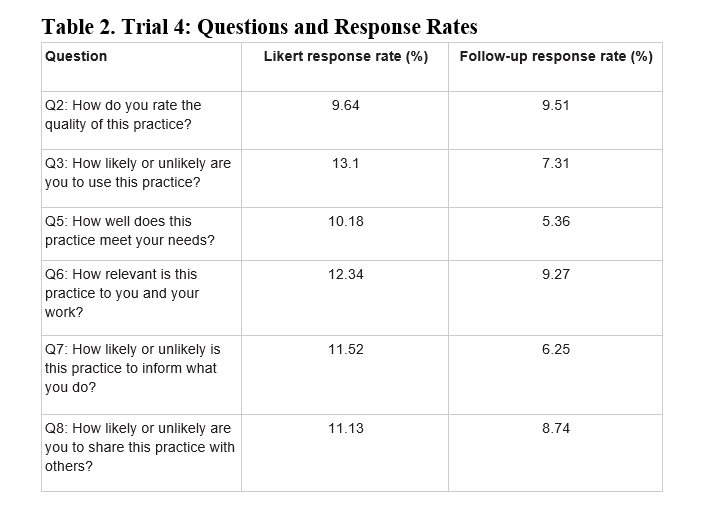
- Optimisation works. In our final micro-randomised trial (see Table 2), combining 40-second timing with fewer clicks boosted response rates from 4.18% to 11.31%. We also found that the more positively someone responded to the first question, the more likely they were to answer the second question.
Why this matters
Optimised microsurveys can:
- Strengthen feedback loops between intermediaries and their audiences, allowing for continuous improvement of websites to best support their mission to promote the use of research evidence.
- Facilitate the study of the appraisal and intention to apply research evidence through rating scales and elaborative/explanatory responses.
- Prompt user reflection and intention setting about their use of research evidence, which may promote the actual use of research evidence in real-world settings.
Recommendations
For intermediaries posting research evidence on websites:
- Supplement Google Analytics with user-centred tools, like microsurveys.
- Collaborate with industry professionals to improve support (e.g. recommendations for configurations) and pricing for non-business/e-commerce applications.
- Keep questions short, configure pop-up timing after adequate engagement with the evidence and reduce clicks.
For researchers
- Trust lower response rates when the total number of responses is high (Fosnacht et al., 2017).
- Repeat these optimisation trials with different websites and different audiences to refine best practices.
- Explore the extent to which microsurvey responses are associated with changes in real-world practice.
Ultimately, a well-designed microsurvey can be a small-but-mighty tool in helping intermediaries improve the use of research evidence by making feedback more timely, relevant and actionable.
References
Fosnacht, K., Sarraf, S., Howe, E. & Peck, L. K. (2017). How important are high response rates for college surveys?, The Review of Higher Education, 40(2), 245-265.
Image credit: Authors’ own.
Read the original research in Evidence & Policy:
Eldeeb, N. Ren, C. & Shapiro, V.B. (2025). Promoting the use of research evidence from websites: optimising microsurveys as feedback loops to drive improvement. Evidence & Policy, DOI: 10.1332/17442648Y2025D000000057.
If you enjoyed this blog post, you may also be interested in reading:
Disclaimer: The views and opinions expressed on this blog site are solely those of the original blog post authors and other contributors. These views and opinions do not necessarily represent those of the Policy Press and/or any/all contributors to this site.
